Change Language :
iglidur® R - Material data
Material table
General specification
Unit
iglidur® R
Test method
density
g/cm³
1,39
Colour
dark red
max. Moisture absorption at 23°C/50% room humidity.
% by weight
0,2
DIN 53495
max. total moisture absorption
wt.-%
1,1
Sliding friction coefficient, dynamic, against steel
µ
0,09 - 0,25
pv value, max. (dry)
MPa x m/s
0,27
Mechanical specification
flexural modulus
MPa
1.950
DIN 53457
flexural strength at 20°C
MPa
70
DIN 53452
Compressive strength
MPa
68
maximum recommended surface pressure (20°C)
MPa
23
Shore D hardness
77
DIN 53505
Physical and thermal specification
Upper long-term application temperature
°C
+90
upper short-term application temperature
°C
+110
Lower application temperature
°C
-50
thermal conductivity
[W/m x K]
0,25
ASTM C 177
coefficient of thermal expansion (at 23°C)
[K-1 x 10⁻⁵]
11
DIN 53752
Electrical specification
Volume resistivity
Ωcm
> 1012
DIN IEC 93
surface resistance
Ω
> 1012
DIN 53482
Table 01: Material data
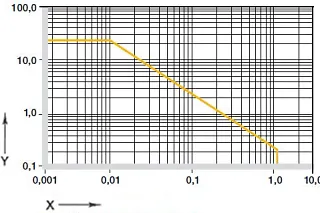
diagram. 01: Permissible pv value for iglidur® R plain bearings with 1 mm wall thickness in dry operation against a steel shaft, at +20 °C, installed in a steel housing
X = surface speed [m/s]
Y = load [MPa]
When developing iglidur® R as a plain bearing material, the focus was on high performance and a very low price. In particular, low friction and wear values were to be achieved in dry operation. The PTFE- and silicone-free material achieves outstandingly low coefficients of friction in dry operation and runs largely stick-slip-free.
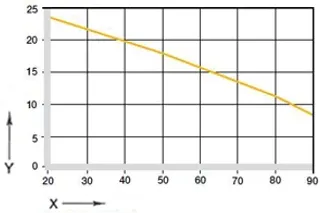
diagram. 02: maximum recommended surface pressure as a function of temperature (23 MPa at +20 °C)
X = temperature [°C]
Y = load [MPa]
Mechanical specification
The maximum recommended surface pressure represents a mechanical material parameter. It is not possible to draw conclusions about the tribology from this. the compressive strength of iglidur® R plain bearings decreases with increasing temperatures. diagram 02 illustrates this relationship.
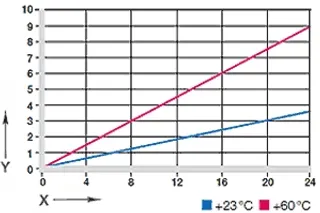
Diagram 03: Deformation under pressure and temperature
X = load [MPa]
Y = Deformation [%]
diagram. 03 shows the elastic deformation of iglidur® R under radial load. Under the maximum permissible load of 23 MPa, the deformation is 4 %. Plastic deformation can be neglected up to this value. However, it also depends on the duration of the load.
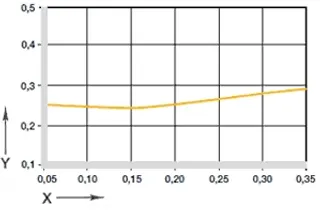
Diagram 04: Coefficient of friction as a function of the surface speed, p = 0.75MPa
X = surface speed [m/s]
Y = coefficient of friction μ
Friction and wear
The coefficient of friction decreases with increasing load, as does the wear resistance. iglidur® R is particularly suitable for applications in which high pv values are mainly caused by the high surface speed and not so much by the surface pressure. The dependence of the coefficient of friction of iglidur® R plain bearings on shaft roughness is less pronounced.

Shaft materials
Diagrams 06 and 07 show an extension of the results of tests with different shaft materials that were carried out with plain bearings from iglidur® R. At 0.3 m/s and 1 MPa, the high grade steel and Cf53 shafts are the best sliding partners. With increasing load, iglidur®®R-bearing with Cf53 and 304 SS shafts show the best wear behaviour, while hard chrome-plated shafts prove to be a good sliding partner in swivel operation.
If the shaft material you intend to use is not included in the test results presented here, please contact us.


Contact us
Contact details

Opening hours
Office hours
Monday to Friday from 8 am - 8 pm.
Live chat:
24h